Summary: Latitude vs. Max Temperature
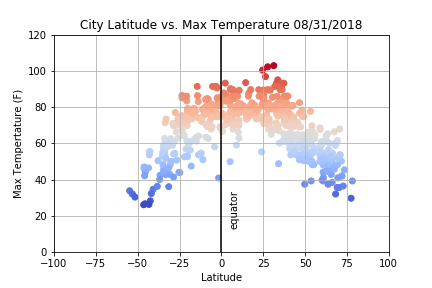
 As expected, the weather becomes significantly warmer as one approaches the equator (0 Deg. Latitude).
More interestingly, however, this graph can change depending on the season when the analysis is performed.
Since this analysis was performed in August, the temperature is almost equally distributed.
An analysis is June might have resulted in a shift in graph with more temperature towards northern hemisphere.
Similarly we would have seen higher temperatures in southern hemisphere during the months of January.


